6.1 Measures of Regression Fit
We’ll start this chapter by learning about measures of how well a regression fits the data. Consider the following figure
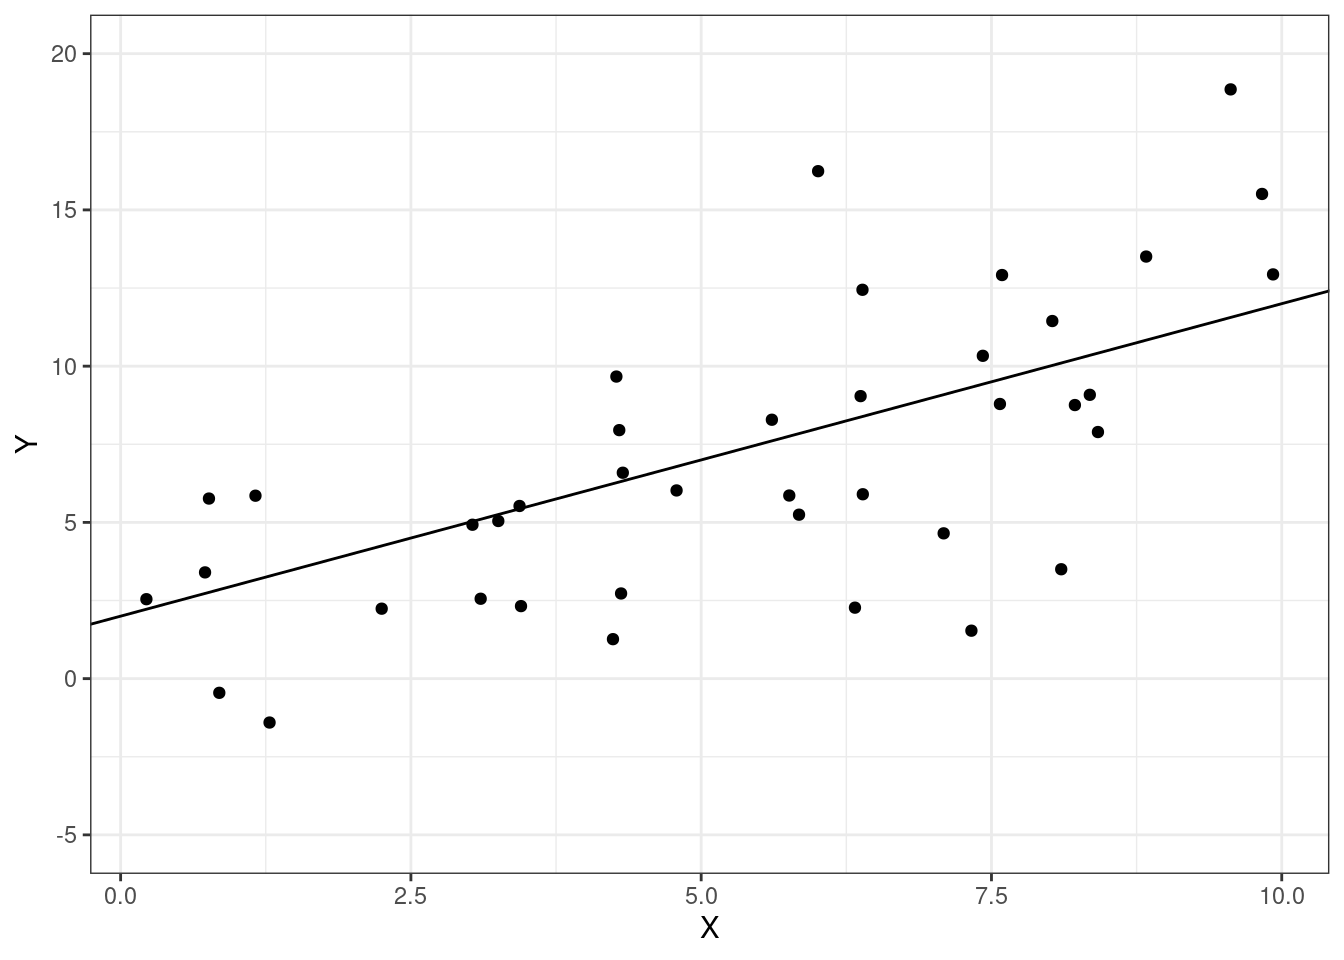
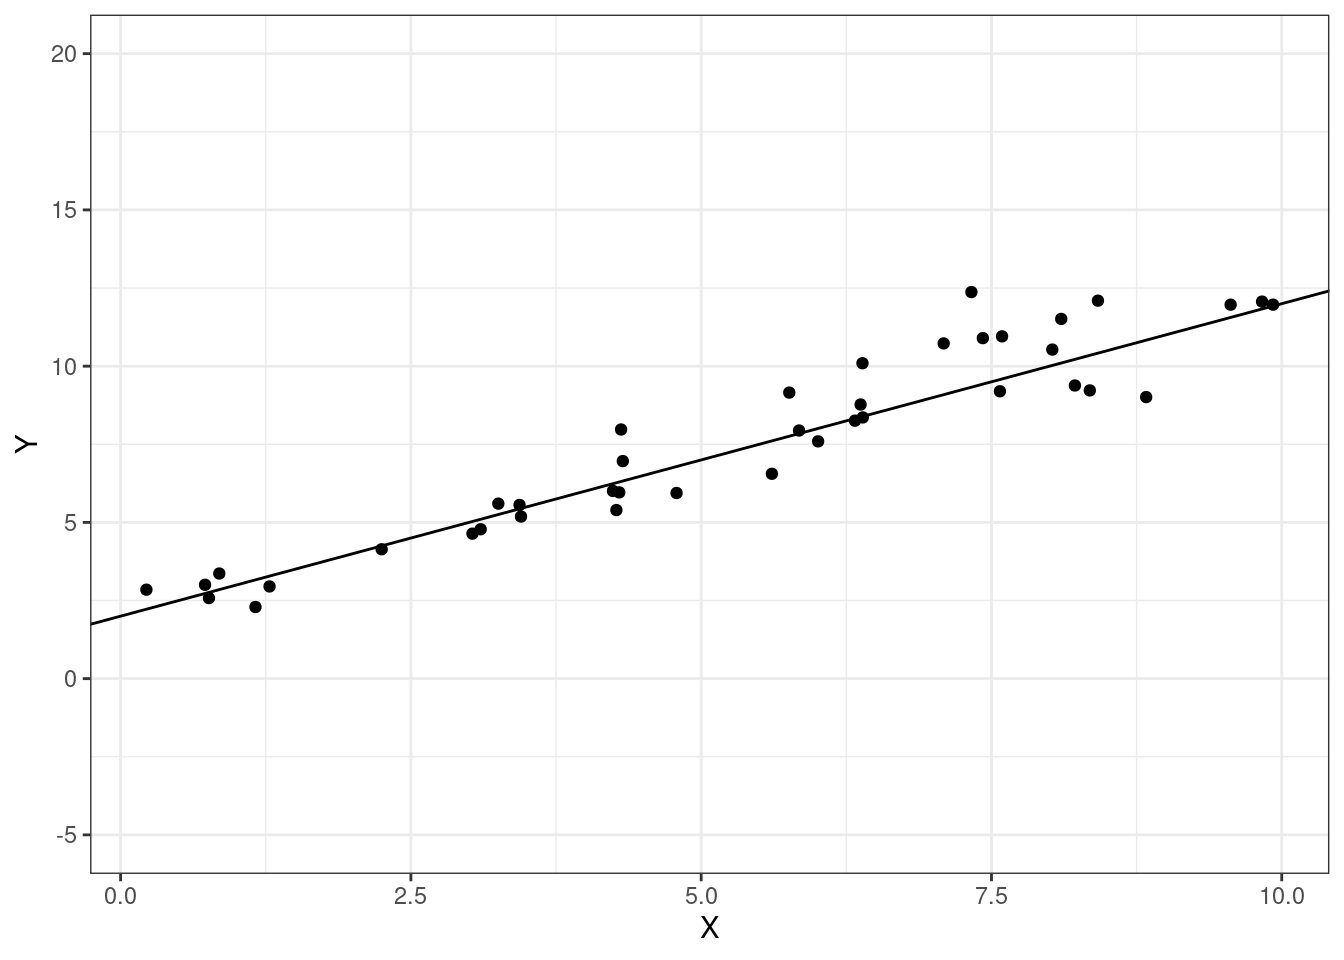 These are exactly the same two regression lines. But we probably have the sense that the regression line in the second figure “fits better” than in the first figure, and, furthermore, that this is likely to result in better predictions of whatever the second outcome is relative to the first one. We’ll formalize this below.
6.1.1 TSS, ESS, SSR
SW 6.4
Let’s start by defining some quantities. These will be useful for quantifying how well the model fits the data.
Total Sum of Squares (TSS) — measures total variation in the data
\[ TSS = \sum_{i=1}^n (Y_i - \bar{Y})^2 \]
Explained Sum of Squares (ESS) — measures variation explained by the model
\[ ESS = \sum_{i=1}^n (\hat{Y}_i - \bar{Y})^2 \]
Sum of Squared Residuals (SSR) — measures “leftover” variation in the data that is not explained by the model
\[ SSR = \sum_{i=1}^n \hat{U}_i^2 = \sum_{i=1}^n (Y_i - \hat{Y}_i)^2 \]
Properties
A first useful property is
\[ TSS = ESS + SSR \]
We will not prove this property though it is a useful exercise and not actually that challenging.
Another useful property is that \(TSS\), \(ESS\), and \(SSR\) are all positive — this holds because they all involve sums of squared quantities.
6.1.2 \(R^2\)
SW 6.4
\(R^2\) is probably the most common measure of regression fit. It is defined as
\[ R^2 := \frac{ESS}{TSS} \]
so that \(R^2\) is the fraction of the variation in \(Y\) explained by the model. Notice that \(R^2\) is always between 0 and 1 which holds by the two properties of \(TSS\), \(ESS\), and \(SSR\) listed in the previous section.