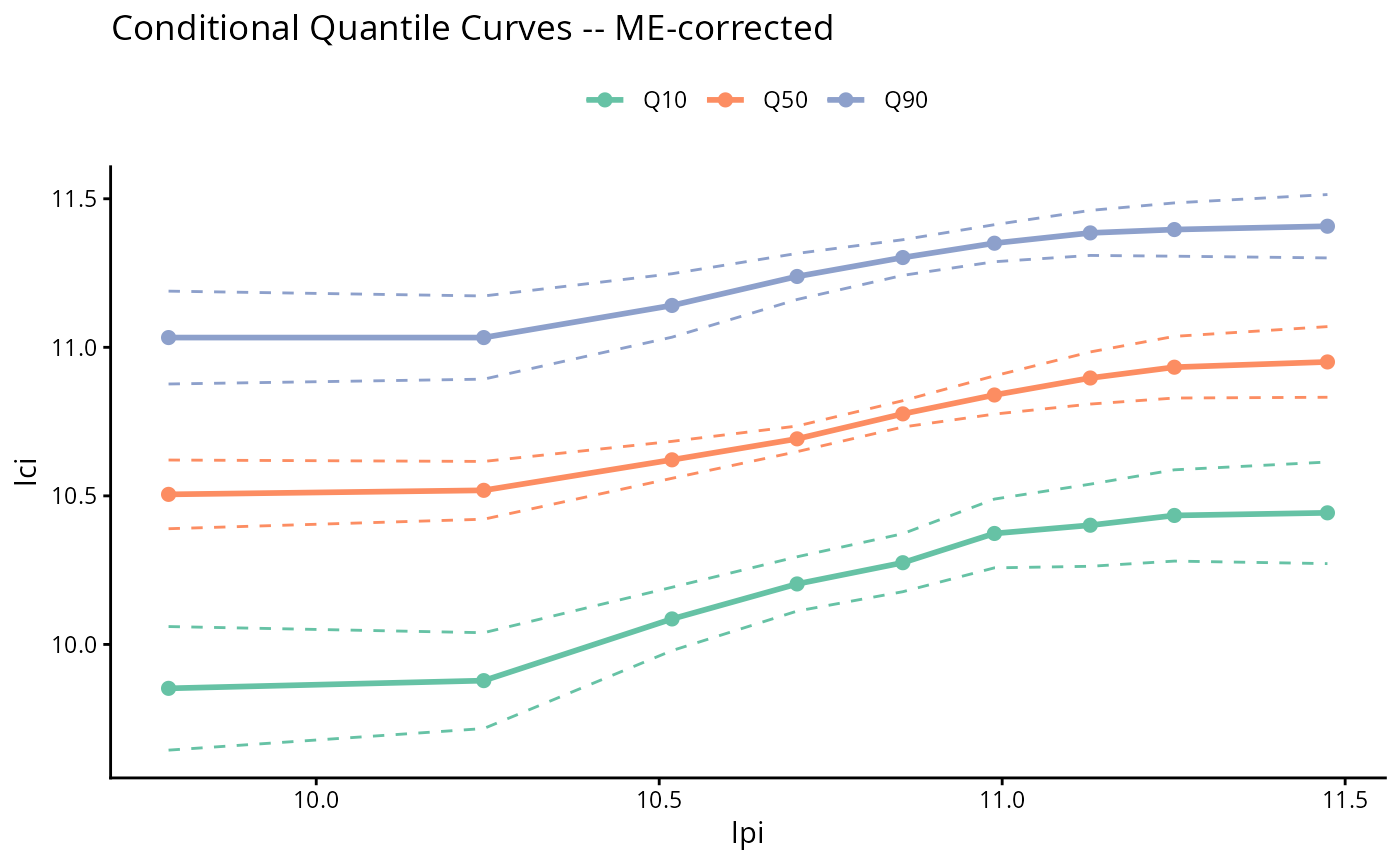
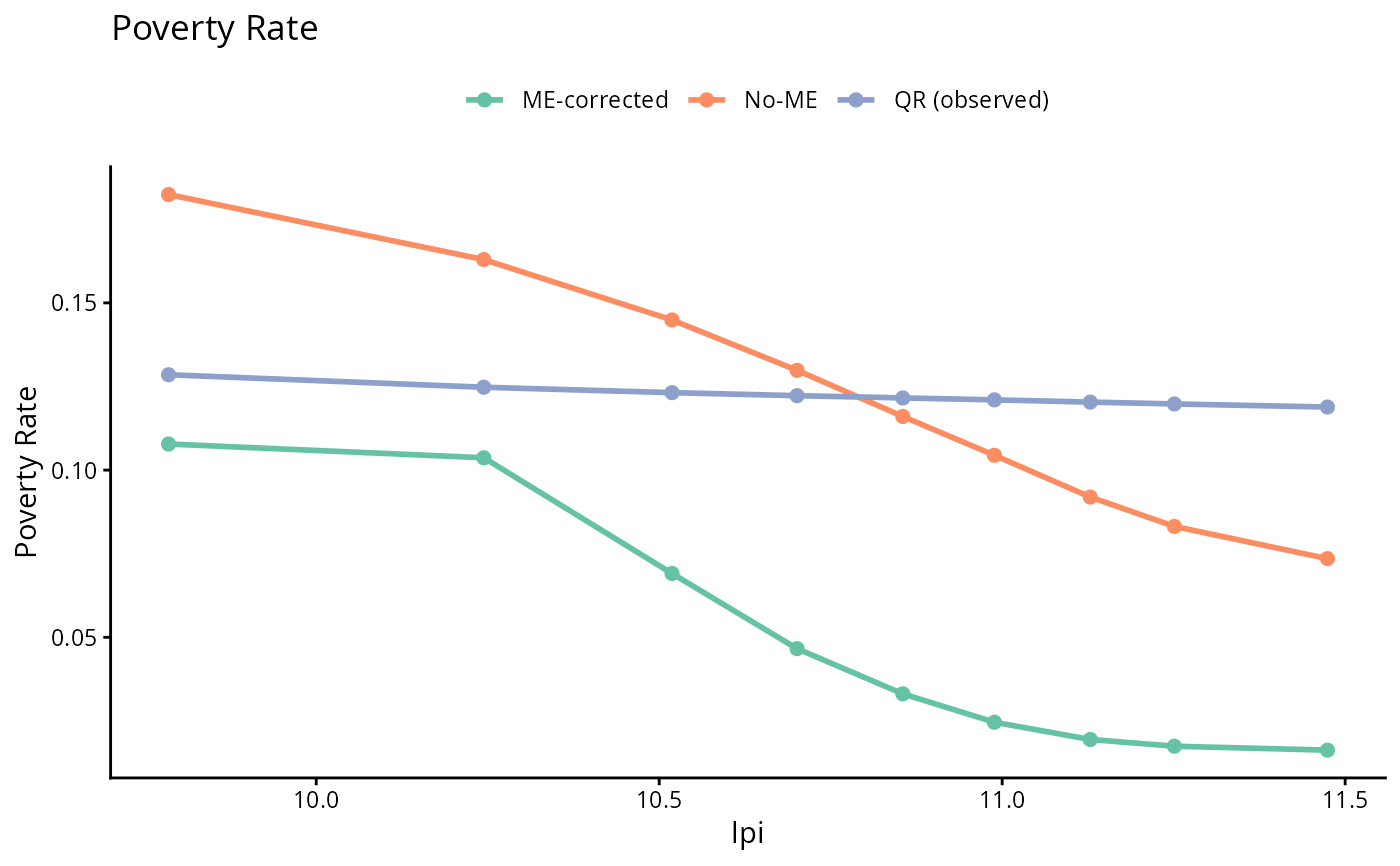
ggplot2-based plot method for tsme objects. Returns a
ggplot object that can be further customized.
Arguments
- object
a tsme object returned by
tsme- type
plot type:
"cond_quant"(conditional quantile curves, default) or"pov_rate"(poverty rates)- which
which estimator to display:
"me"(ME-corrected, default),"nome"(no-ME),"qr"(standard QR), or"all"(all three on one plot; only valid whentype = "pov_rate")- ci
logical; add confidence bands when bootstrap SEs are available (default
TRUE)- level
confidence level for the bands (default 0.90)
- ...
unused