\[
\newcommand{\E}{\mathbb{E}}
\renewcommand{\P}{\textrm{P}}
\let\L\relax
\newcommand{\L}{\textrm{L}} %doesn't work in .qmd, place this command at start of qmd file to use it
\newcommand{\F}{\textrm{F}}
\newcommand{\var}{\textrm{var}}
\newcommand{\cov}{\textrm{cov}}
\newcommand{\corr}{\textrm{corr}}
\newcommand{\Var}{\mathrm{Var}}
\newcommand{\Cov}{\mathrm{Cov}}
\newcommand{\Corr}{\mathrm{Corr}}
\newcommand{\sd}{\mathrm{sd}}
\newcommand{\se}{\mathrm{s.e.}}
\newcommand{\T}{T}
\newcommand{\indicator}[1]{\mathbb{1}\{#1\}}
\newcommand\independent{\perp \!\!\! \perp}
\newcommand{\N}{\mathcal{N}}
\]
SW 4.5, 5.1, 5.2, 6.6
In this chapter, we’ll study the properties of \(\hat{\beta}_1\) as an estimator of \(\beta_1\). This closely parallels our earlier discussion of the properties of \(\bar{Y}\) as an estimator of \(\E[Y]\). Since \(\hat{\beta}_1\) is computed from a random sample, it is itself a random variable, and we will be interested in the same properties as before: its mean (is it unbiased?), its sampling variance, whether it is consistent, and its asymptotic distribution (which is what we need in order to conduct inference).
We will focus on the simple linear regression model \[
Y = \beta_0 + \beta_1 X + U, \qquad \E[U|X] = 0
\] and assume that we have a random sample \(\{(Y_i, X_i)\}_{i=1}^n\). Recall that \[
\hat{\beta}_1 = \frac{\widehat{\cov}(X,Y)}{\widehat{\var}(X)}
\tag{12.1}\] Some of the material in this chapter is advanced, but I suggest that you study it.
12.1 A Useful Expression for \(\hat{\beta}_1\)
Before studying the properties of \(\hat{\beta}_1\), it is helpful to rewrite it in a way that we will use repeatedly below.
Helpful Intermediate Result 1 Notice that \[\begin{align*}
\frac{1}{n}\sum_{i=1}^n \Big( (X_i - \bar{X})\bar{Y}\Big) &= \bar{Y} \frac{1}{n}\sum_{i=1}^n \Big( X_i-\bar{X} \Big) \\
&= \bar{Y} \left( \frac{1}{n}\sum_{i=1}^n X_i - \frac{1}{n}\sum_{i=1}^n \bar{X} \right) \\
&= \bar{Y} \Big(\bar{X} - \bar{X} \Big) \\
&= 0
\end{align*}\] where the first equality just pulls \(\bar{Y}\) out of the summation (it is a constant with respect to the summation), the second equality pushes the summation through the difference, the first part of the third equality holds by the definition of \(\bar{X}\) and the second part holds because it is an average of a constant.
This implies that \[
\frac{1}{n}\sum_{i=1}^n \Big( (X_i - \bar{X})(Y_i - \bar{Y})\Big) = \frac{1}{n}\sum_{i=1}^n \Big( (X_i - \bar{X})Y_i\Big)
\tag{12.2}\] and very similar arguments (basically the same arguments in reverse) also imply that \[
\frac{1}{n}\sum_{i=1}^n \Big( (X_i - \bar{X})X_i\Big) = \frac{1}{n}\sum_{i=1}^n \Big( (X_i - \bar{X})(X_i - \bar{X})\Big)
\tag{12.3}\] We use both Equation 12.2 and Equation 12.3 below.
Next, consider the numerator in Equation 12.1\[\begin{align*}
\widehat{\cov}(X,Y) &= \frac{1}{n} \sum_{i=1}^n (X_i - \bar{X})(Y_i - \bar{Y}) \\
&= \frac{1}{n} \sum_{i=1}^n (X_i - \bar{X})Y_i \\
&= \frac{1}{n} \sum_{i=1}^n (X_i - \bar{X})(\beta_0 + \beta_1 X_i + U_i) \\
&= \underbrace{\beta_0 \frac{1}{n} \sum_{i=1}^n (X_i - \bar{X})}_{(A)} + \underbrace{\beta_1 \frac{1}{n} \sum_{i=1}^n (X_i - \bar{X}) X_i}_{(B)} + \underbrace{\frac{1}{n} \sum_{i=1}^n (X_i - \bar{X}) U_i}_{(C)} \\
\end{align*}\] where the first equality holds by the definition of sample covariance, the second equality holds by Equation 12.2, the third equality plugs in for \(Y_i\), and the last equality combines terms and passes the summation through the additions/subtractions.
Now, let’s consider each of these in turn.
For (A), \[\begin{align*}
\frac{1}{n} \sum_{i=1}^n X_i = \bar{X} \qquad \textrm{and} \qquad \frac{1}{n} \sum_{i=1}^n \bar{X} = \bar{X}
\end{align*}\] which implies that this term is equal to 0.
For (B), notice that \[\begin{align*}
\beta_1 \frac{1}{n} \sum_{i=1}^n (X_i - \bar{X}) X_i &= \beta_1 \frac{1}{n} \sum_{i=1}^n (X_i - \bar{X}) (X_i - \bar{X}) \\
&= \beta_1 \widehat{\var}(X)
\end{align*}\] where the first equality holds by Equation 12.3 and the second equality holds by the definition of sample variance.
For (C), well, we’ll just carry that one around for now.
Plugging in the expressions for (A), (B), and (C) back into Equation Equation 12.1 implies that \[
\hat{\beta}_1 = \beta_1 + \frac{\frac{1}{n} \sum_{i=1}^n (X_i - \bar{X}) U_i}{\widehat{\var}(X)}
\tag{12.4}\] In words, \(\hat{\beta}_1\) is equal to \(\beta_1\) plus a second term that depends on the error terms. Each of the properties below comes from studying this second term.
12.2 Mean of \(\hat{\beta}_1\)
It is convenient to first take expectations conditional on all of the \(X\)’s in the sample, \(X_1, \ldots, X_n\). Conditioning on all of the \(X\)’s may seem strange at first. It amounts to treating the \(X\)’s in our sample as fixed and only thinking about the randomness that comes from the error terms. This is just a convenient technical step: it makes \(\bar{X}\) and \(\widehat{\var}(X)\) behave like constants, and, at the end, we use the law of iterated expectations to average over the \(X\)’s, so that the final result does not depend on the particular \(X\)’s in our sample. Starting from Equation 12.4, \[
\begin{aligned}
\E[\hat{\beta}_1 | X_1,\ldots,X_n] &= \beta_1 + \frac{\frac{1}{n} \sum_{i=1}^n (X_i - \bar{X}) \E[U_i | X_1, \ldots, X_n]}{\widehat{\var}(X)} \\
&= \beta_1
\end{aligned}
\] where the last equality holds because \(\E[U_i | X_1, \ldots, X_n] = \E[U_i | X_i] = 0\) (the first equality holds by random sampling — other observations’ \(X\)’s are independent of \(U_i\) — and the second holds because \(\E[U|X]=0\)). Then, by the law of iterated expectations, \[
\E[\hat{\beta}_1] = \E\big[ \E[\hat{\beta}_1 | X_1,\ldots,X_n] \big] = \beta_1
\] so \(\hat{\beta}_1\) is unbiased.
12.3 Sampling Variance of \(\hat{\beta}_1\)
As for \(\bar{Y}\), it is important to know how much \(\hat{\beta}_1\) varies across different samples. It is possible to show that, in large samples, \[
\var(\hat{\beta}_1) \approx \frac{V}{n} \qquad \textrm{where} \qquad V = \frac{\E[(X-\E[X])^2 U^2]}{\var(X)^2}
\tag{12.5}\] I provide a derivation of this result in Section 12.10 at the end of this chapter. This expression tells us when \(\hat{\beta}_1\) will be precisely estimated (i.e., have a small sampling variance):
Larger sample size: just as for \(\bar{Y}\), the sampling variance gets smaller as \(n\) gets larger.
More variation in \(X\): \(\var(X)\) shows up (squared) in the denominator. Intuitively, if all of the observations have similar values of \(X\), it is hard to learn how the average of \(Y\) differs across values of \(X\); if \(X\) is very spread out, this is much easier.
Less variation in \(U\): \(U^2\) shows up in the numerator. If outcomes tend to be far from the regression line, it is harder to pin down where the regression line is.
12.4 Consistency
Starting from Equation 12.4, the numerator of the second term is an average, so by the law of large numbers, \[
\frac{1}{n}\sum_{i=1}^n (X_i - \bar{X}) U_i \xrightarrow{p} \E[(X-\E[X])U]
\] (here and below, I am glossing over the difference between \(\bar{X}\) and \(\E[X]\), which does not matter in large samples). By the law of iterated expectations, \[
\E[(X-\E[X])U] = \E\big[(X-\E[X])\E[U|X]\big] = 0
\] Similarly, \[
\widehat{\var}(X) \xrightarrow{p} \var(X)
\] which is positive as long as \(X\) is not constant. Thus, the second term converges to 0, and \[
\hat{\beta}_1 \xrightarrow{p} \beta_1
\] that is, \(\hat{\beta}_1\) is consistent.
12.5 Asymptotic Normality
Finally, to conduct inference, we need the asymptotic distribution of \(\hat{\beta}_1\). We are going to show that \[
\sqrt{n}(\hat{\beta}_1 - \beta_1) \rightarrow N(0,V) \quad \textrm{as} \ n \rightarrow \infty
\] where \(V\) is the same as in Equation 12.5.
Re-arranging Equation 12.4 and multiplying both sides by \(\sqrt{n}\) implies that \[\begin{align*}
\sqrt{n}(\hat{\beta}_1 - \beta_1) &= \sqrt{n} \left(\frac{1}{n} \sum_{i=1}^n \frac{(X_i - \bar{X}) U_i}{\widehat{\var}(X)}\right) \\
& \approx \sqrt{n} \left(\frac{1}{n} \sum_{i=1}^n \frac{(X_i - \E[X]) U_i}{\var(X)}\right)
\end{align*}\] The last line (the approximately one) is kind of a weak argument, but basically you can replace \(\bar{X}\) and \(\widehat{\var}(X)\) and the effect of this replacement will converge to 0 in large samples (this is the reason for the approximately) — if you want a more complete explanation, sign up for my graduate econometrics class next semester.
Is this helpful? It may not be obvious, but the right hand side of the above equation is actually something that we can apply the Central Limit Theorem to. In particular, maybe it is helpful to define \[
Z_i = \frac{(X_i - \E[X]) U_i}{\var(X)}
\] We know that we could apply a Central Limit Theorem to \[
\sqrt{n}\left( \frac{1}{n} \sum_{i=1}^n Z_i \right)
\] if (i) \(Z_i\) had mean 0, and (ii) it is iid. That it is iid holds immediately from the random sampling assumption. For mean 0, \[\begin{align*}
\E[Z] &= \E\left[ \frac{(X - \E[X]) U}{\var(X)}\right] \\
&= \frac{1}{\var(X)} \E[(X - \E[X]) U] \\
&= \frac{1}{\var(X)} \E[(X - \E[X]) \underbrace{\E[U|X]}_{=0}] \\
&= 0
\end{align*}\] where the only challenging line here is the third one holds from the Law of Iterated Expectations. This means that we can apply the central limit theorem, and in particular, \[
\sqrt{n} \left( \frac{1}{n} \sum_{i=1}^n Z_i \right) \rightarrow N(0,V) \qquad \textrm{where} \qquad V=\var(Z) = \E[Z^2]
\] (where the 2nd equality here holds because \(Z\) has mean 0). Now, just substituting back in for \(Z\) implies that \[\begin{align*}
\sqrt{n}(\hat{\beta}_1 - \beta_1) \rightarrow N(0,V)
\end{align*}\] where \[
\begin{aligned}
V &= \E\left[ \left( \frac{(X - \E[X]) U}{\var(X)} \right)^2 \right] \nonumber \\
&= \E\left[ \frac{(X - \E[X])^2 U^2}{\var(X)^2}\right]
\end{aligned}
\] which is what we were aiming for. Notice that this lines up with the sampling variance of \(\hat{\beta}_1\) that we discussed above: in large samples, \(\hat{\beta}_1\) is approximately normally distributed with mean \(\beta_1\) and variance \(V/n\).
12.6 Inference
Given this result, all our previous work on standard errors, t-statistics, p-values, and confidence intervals applies. First, let me mention the way that you would estimate \(V\) (same as always, just replace the population quantities with corresponding sample quantities).
Interestingly, these are not exactly the same as what comes from the lm command. Here’s what the difference is: R makes a simplifying assumption called “homoskedasticity” that simplifies the expression for the variance. This can result in slightly different standard errors (and therefore slightly different t-statistics, p-values, and confidence intervals too) than the ones we calculated.
An alternative package that is popular among economists for estimating regressions and getting “heteroskedasticity robust” standard errors is the estimatr package.
Call:
lm_robust(formula = mpg ~ hp, data = mtcars, se_type = "HC0")

Standard error type:  HC0

Coefficients:
            Estimate Std. Error t value  Pr(>|t|) CI Lower CI Upper DF
(Intercept) 30.09886    2.01067  14.970 1.851e-15 25.99252 34.20520 30
hp          -0.06823    0.01313  -5.196 1.338e-05 -0.09504 -0.04141 30

Multiple R-squared:  0.6024 ,   Adjusted R-squared:  0.5892
F-statistic:    27 on 1 and 30 DF,  p-value: 1.338e-05
The “HC0” standard errors are “heteroskedasticity consistent” standard errors, and you can see that they match what we calculated above.
12.7 More than One Regressor
Everything in this chapter has been for the simple linear regression model with a single regressor. With more regressors, the derivations are similar (though they require more notation), and the estimated coefficients have similar properties: under random sampling and \(\E[U|X_1,\ldots,X_k]=0\), each \(\hat{\beta}_j\) is unbiased, consistent, and asymptotically normal. Its sampling variance is smaller when the sample size is larger, when there is more variation in \(X_j\) that is not explained by the other regressors, and when there is less variation in \(U\). The standard errors, t-statistics, p-values, and confidence intervals reported by lm and lm_robust are based on this more general case.
12.8 Lab 4: Birthweight and Smoking
For this lab, we’ll use the data Birthweight_Smoking and study the relationship between infant birthweight and mother’s smoking behavior.
Run a regression of \(birthweight\) on \(smoker\). How do you interpret the results?
Use the datasummary_balance function from the modelsummary package to provide summary statistics for each variable in the data separately by smoking status of the mother. Do you notice any interesting patterns?
Now run a regression of \(birthweight\) on \(smoker\), \(educ\), \(nprevisit\), \(age\), and \(alcohol\). How do you interpret the coefficient on \(smoker\)? How does its magnitude compare to the result from #1? What do you make of this?
Now run a regression of \(birthweight\) on \(smoker\), the interaction of \(smoker\) and \(age\) and the other covariates (including \(age\)) from #3. How do you interpret the coefficient on \(smoker\) and the coefficient on the interaction term?
Now run a regression of \(birthweight\) on \(smoker\), the interaction of \(smoker\) and \(alcohol\) and the other covariates from #3. How do you interpret the coefficient on \(smoker\) and the coefficient on the interaction term?
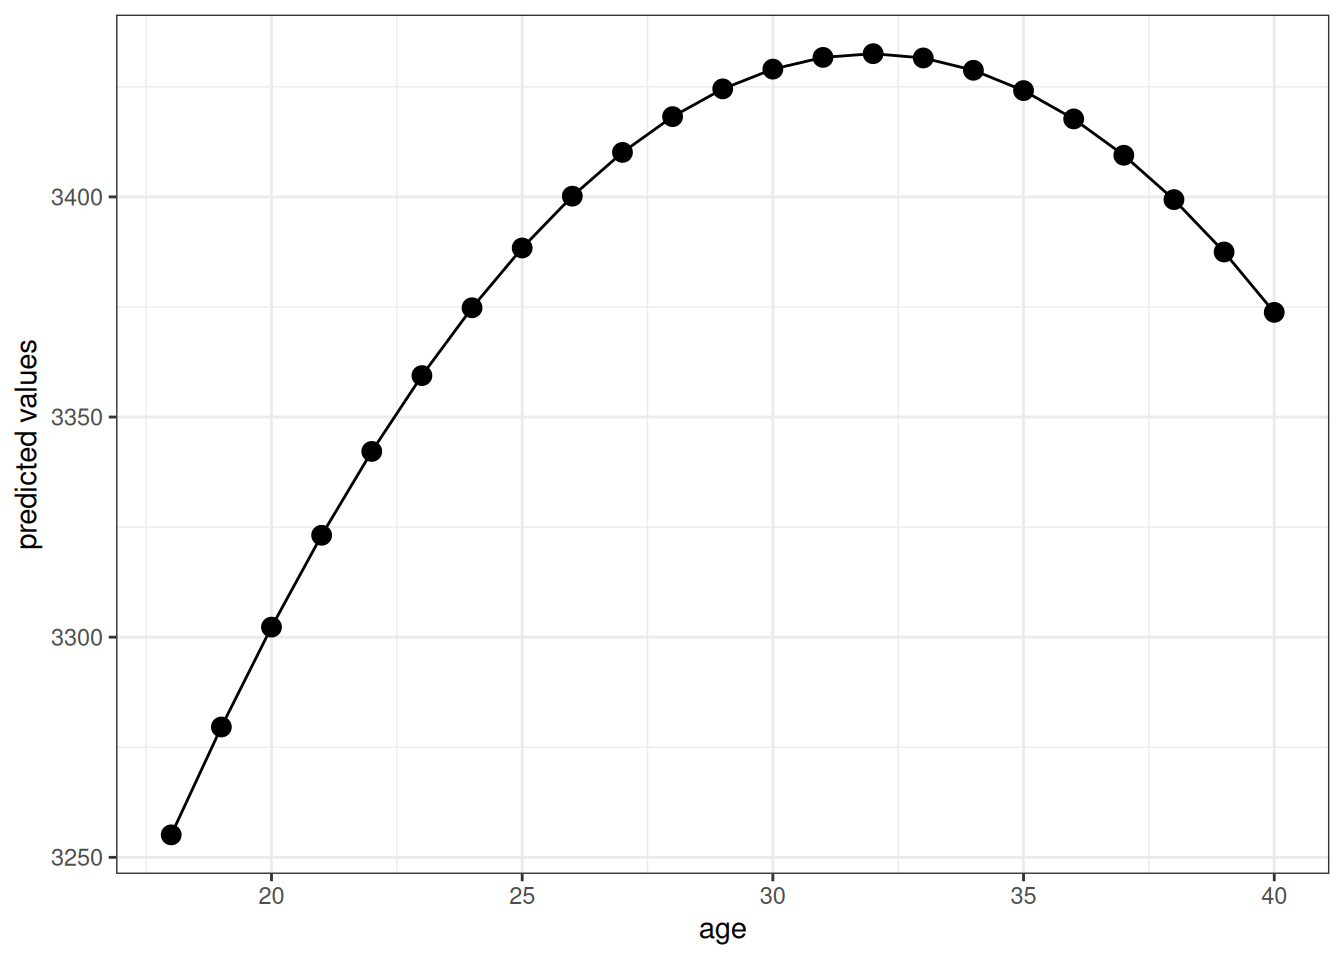
Now run a regression of \(birthweight\) on \(age\) and \(age^2\). Plot the predicted value of birthweight as a function of age for ages from 18 to 44. What do you make of this?
Now run a regression of \(\log(birthweight)\) on \(smoker\) and the other covariates from #3. How do you interpret the coefficient on \(smoker\)?
Call:
lm(formula = birthweight ~ smoker, data = Birthweight_Smoking)

Residuals:
     Min       1Q   Median       3Q      Max
-3007.06  -313.06    26.94   366.94  2322.94

Coefficients:
            Estimate Std. Error t value Pr(>|t|)
(Intercept)  3432.06      11.87 289.115   <2e-16 ***
smoker       -253.23      26.95  -9.396   <2e-16 ***
---
Signif. codes:  0 '***' 0.001 '**' 0.01 '*' 0.05 '.' 0.1 ' ' 1

Residual standard error: 583.7 on 2998 degrees of freedom
Multiple R-squared:  0.0286,    Adjusted R-squared:  0.02828
F-statistic: 88.28 on 1 and 2998 DF,  p-value: < 2.2e-16
We estimate that, on average, babies whose mothers smoked weighed about 250 grams less at birth than babies whose mothers did not smoke. This difference is strongly statistically significant, and (I am not an expert but) it seems large to me.
# create smoker factor --- just to make table look nicerBirthweight_Smoking$smoker_factor <-as.factor(ifelse(Birthweight_Smoking$smoker==1, "smoker", "non-smoker"))datasummary_balance(~smoker_factor, data=dplyr::select(Birthweight_Smoking, -smoker),fmt=2)
non-smoker (N=2418)
smoker (N=582)
Mean
Std. Dev.
Mean
Std. Dev.
Diff. in Means
Std. Error
nprevist
11.19
3.50
10.18
4.23
-1.01
0.19
alcohol
0.01
0.11
0.05
0.22
0.04
0.01
tripre1
0.83
0.38
0.70
0.46
-0.13
0.02
tripre2
0.14
0.34
0.22
0.41
0.08
0.02
tripre3
0.03
0.16
0.06
0.24
0.04
0.01
tripre0
0.01
0.08
0.02
0.15
0.02
0.01
birthweight
3432.06
584.62
3178.83
580.01
-253.23
26.82
unmarried
0.18
0.38
0.43
0.50
0.25
0.02
educ
13.15
2.21
11.88
1.62
-1.27
0.08
age
27.27
5.37
25.32
5.06
-1.95
0.24
drinks
0.03
0.47
0.19
1.23
0.16
0.05
The things that stand out to me are:
Birthweight tends to be notably lower for smokers relative to non-smokers. The difference is about 7.4% lower birthweight for babies whose mothers smoked.
That said, smoking is also correlated with a number of other things that could be related to lower birthweights. Mothers who smoke went to fewer pre-natal visits on average, were more likely to be unmarried, were more likely to have drink alcohol during their pregnancy, were more likely to be less educated. They also were, on average, somewhat younger than mothers who did not smoke.
Call:
lm(formula = birthweight ~ smoker + educ + nprevist + age + alcohol,
    data = Birthweight_Smoking)

Residuals:
     Min       1Q   Median       3Q      Max
-2728.91  -305.26    24.69   359.63  2220.42

Coefficients:
            Estimate Std. Error t value Pr(>|t|)
(Intercept) 2924.963     74.185  39.428  < 2e-16 ***
smoker      -206.507     27.367  -7.546 5.93e-14 ***
educ           5.644      5.532   1.020    0.308
nprevist      32.979      2.914  11.318  < 2e-16 ***
age            2.360      2.178   1.083    0.279
alcohol      -39.512     76.365  -0.517    0.605
---
Signif. codes:  0 '***' 0.001 '**' 0.01 '*' 0.05 '.' 0.1 ' ' 1

Residual standard error: 570.3 on 2994 degrees of freedom
Multiple R-squared:  0.07402,   Adjusted R-squared:  0.07247
F-statistic: 47.86 on 5 and 2994 DF,  p-value: < 2.2e-16
Here we estimate that, comparing mothers with the same education, number of pre-natal visits, age, and alcohol consumption, babies whose mothers smoked weighed about 200 grams less on average than babies whose mothers did not smoke. The magnitude of this difference is somewhat smaller than the previous estimate. Due to the discussion in #2 (particularly, that smoking was correlated with a number of other characteristics that are likely associated with lower birthweights), this decrease in the magnitude is not surprising.
Call:
lm(formula = birthweight ~ smoker + I(smoker * age) + educ +
    nprevist + age + alcohol, data = Birthweight_Smoking)

Residuals:
     Min       1Q   Median       3Q      Max
-2722.56  -305.12    23.93   363.43  2244.67

Coefficients:
                Estimate Std. Error t value Pr(>|t|)
(Intercept)     2853.819     77.104  37.013  < 2e-16 ***
smoker           231.578    134.854   1.717 0.086036 .
I(smoker * age)  -17.145      5.168  -3.317 0.000919 ***
educ               4.895      5.528   0.885 0.375968
nprevist          32.482      2.913  11.151  < 2e-16 ***
age                5.528      2.375   2.328 0.019999 *
alcohol          -22.556     76.409  -0.295 0.767864
---
Signif. codes:  0 '***' 0.001 '**' 0.01 '*' 0.05 '.' 0.1 ' ' 1

Residual standard error: 569.4 on 2993 degrees of freedom
Multiple R-squared:  0.07741,   Adjusted R-squared:  0.07556
F-statistic: 41.85 on 6 and 2993 DF,  p-value: < 2.2e-16
We should be careful about the interpretation here. We have estimated a model like
\[
\E[Birthweight|Smoker, Age, X] = \beta_0 + \beta_1 Smoker + \beta_2 Smoker \cdot Age + \cdots
\] Therefore, the marginal contrast for smoking is given by
\[
\E[Birthweight | Smoker=1, Age, X] - \E[Birthweight | Smoker=0, Age, X] = \beta_1 + \beta_2 Age
\] Therefore, the marginal contrast for smoking depends on \(Age\). For example, for \(Age=18\), the marginal contrast is \(\beta_1 + \beta_2 (18)\). For \(Age=25\), the marginal contrast is \(\beta_1 + \beta_2 (25)\), and for \(Age=35\), the marginal contrast is \(\beta_1 + \beta_2 (35)\). Let’s calculate the marginal contrast at each of those ages.
This suggests that the difference in average birthweight between babies whose mothers smoked and babies whose mothers did not smoke is substantially larger for older mothers.
Call:
lm(formula = birthweight ~ smoker + I(smoker * alcohol) + educ +
    nprevist + age + alcohol, data = Birthweight_Smoking)

Residuals:
     Min       1Q   Median       3Q      Max
-2728.99  -304.16    24.54   359.92  2222.10

Coefficients:
                    Estimate Std. Error t value Pr(>|t|)
(Intercept)         2924.844     74.185  39.426  < 2e-16 ***
smoker              -201.852     27.765  -7.270 4.57e-13 ***
I(smoker * alcohol) -151.860    152.717  -0.994    0.320
educ                   5.612      5.532   1.014    0.310
nprevist              32.844      2.917  11.260  < 2e-16 ***
age                    2.403      2.178   1.103    0.270
alcohol               39.824    110.440   0.361    0.718
---
Signif. codes:  0 '***' 0.001 '**' 0.01 '*' 0.05 '.' 0.1 ' ' 1

Residual standard error: 570.3 on 2993 degrees of freedom
Multiple R-squared:  0.07432,   Adjusted R-squared:  0.07247
F-statistic: 40.05 on 6 and 2993 DF,  p-value: < 2.2e-16
The point estimate suggests that the difference in average birthweight between babies whose mothers smoked and those whose mothers did not is larger among women who consumed alcohol than among women who did not. This seems plausible, but our evidence is not very strong here — the estimate on the interaction term is not statistically significant at any conventional significance level (the p-value is equal to 0.32).
reg6 <-lm(birthweight ~ age +I(age^2), data=Birthweight_Smoking)summary(reg6)
Call:
lm(formula = birthweight ~ age + I(age^2), data = Birthweight_Smoking)

Residuals:
     Min       1Q   Median       3Q      Max
-2949.81  -312.81    30.43   371.03  2452.72

Coefficients:
             Estimate Std. Error t value Pr(>|t|)
(Intercept) 2502.8949   225.6016  11.094  < 2e-16 ***
age           58.1670    16.9212   3.438 0.000595 ***
I(age^2)      -0.9099     0.3099  -2.936 0.003353 **
---
Signif. codes:  0 '***' 0.001 '**' 0.01 '*' 0.05 '.' 0.1 ' ' 1

Residual standard error: 589.6 on 2997 degrees of freedom
Multiple R-squared:  0.009261,  Adjusted R-squared:  0.0086
F-statistic: 14.01 on 2 and 2997 DF,  p-value: 8.813e-07
Call:
lm(formula = I(log(birthweight)) ~ smoker + educ + nprevist +
    age + alcohol, data = Birthweight_Smoking)

Residuals:
     Min       1Q   Median       3Q      Max
-1.96324 -0.07696  0.02435  0.12092  0.50070

Coefficients:
              Estimate Std. Error t value Pr(>|t|)
(Intercept)  7.9402678  0.0270480 293.562  < 2e-16 ***
smoker      -0.0635764  0.0099782  -6.372 2.16e-10 ***
educ         0.0022169  0.0020171   1.099    0.272
nprevist     0.0129662  0.0010624  12.205  < 2e-16 ***
age          0.0003059  0.0007941   0.385    0.700
alcohol     -0.0181053  0.0278428  -0.650    0.516
---
Signif. codes:  0 '***' 0.001 '**' 0.01 '*' 0.05 '.' 0.1 ' ' 1

Residual standard error: 0.2079 on 2994 degrees of freedom
Multiple R-squared:  0.07322,   Adjusted R-squared:  0.07167
F-statistic: 47.31 on 5 and 2994 DF,  p-value: < 2.2e-16
The estimated coefficient on \(smoker\) says that, comparing mothers with the same education, number of pre-natal visits, age, and alcohol consumption during pregnancy, babies whose mothers smoked during pregnancy weighed about 6.3% less on average.
12.10 In Case You’re Interested: Sampling Variance of \(\hat{\beta}_1\)
This section derives the expression for the sampling variance of \(\hat{\beta}_1\) from the main text. To do this, we will use the law of total variance, which says that, for any two random variables \(W\) and \(Z\), \[
\var(W) = \E\big[\var(W|Z)\big] + \var\big(\E[W|Z]\big)
\] In words, the variance of \(W\) can be split into the average of the conditional variance of \(W\) given \(Z\) (how much \(W\) varies for a fixed value of \(Z\)), plus the variance of the conditional mean of \(W\) given \(Z\) (how much the average of \(W\) varies across different values of \(Z\)).
Applying the law of total variance with \(W = \hat{\beta}_1\) and \(Z = (X_1,\ldots,X_n)\), \[
\begin{aligned}
\var(\hat{\beta}_1) &= \E\big[\var(\hat{\beta}_1 | X_1,\ldots,X_n)\big] + \var\big(\E[\hat{\beta}_1|X_1,\ldots,X_n]\big) \\
&= \E\big[\var(\hat{\beta}_1 | X_1,\ldots,X_n)\big]
\end{aligned}
\] where the second equality holds because we showed above that \(\E[\hat{\beta}_1|X_1,\ldots,X_n] = \beta_1\), which is a constant and therefore has variance equal to 0.
The second equality holds because \(\beta_1\) is a constant and, conditional on the \(X\)’s, \(\widehat{\var}(X)\) is a constant that can be pulled out (squared) from the variance.
The third equality holds because, by random sampling, the \(U_i\)’s are independent of each other conditional on the \(X\)’s, so the variance of the sum is the sum of the variances, and each \((X_i - \bar{X})\) is a constant conditional on the \(X\)’s that can be pulled out (squared).
The fourth equality holds because, by random sampling, \(U_i\) only depends on its own \(X_i\).
Putting this together, \[
\var(\hat{\beta}_1) = \frac{1}{n} \E\left[ \frac{\frac{1}{n}\sum_{i=1}^n (X_i - \bar{X})^2 \sigma^2(X_i)}{\widehat{\var}(X)^2} \right]
\] This expectation is hard to simplify further in general, but, in large samples, \(\widehat{\var}(X) \approx \var(X)\) and \[
\begin{aligned}
\frac{1}{n}\sum_{i=1}^n (X_i - \bar{X})^2 \sigma^2(X_i) &\approx \E[(X-\E[X])^2 \sigma^2(X)] \\
&= \E\big[(X-\E[X])^2 \E[U^2|X]\big] \\
&= \E[(X-\E[X])^2 U^2]
\end{aligned}
\] where the first equality uses that \(\sigma^2(X) = \E[U^2|X]\) (because \(\E[U|X]=0\)), and the second uses the law of iterated expectations. Thus, \[
\var(\hat{\beta}_1) \approx \frac{1}{n} \cdot \frac{\E[(X-\E[X])^2 U^2]}{\var(X)^2} = \frac{V}{n}
\]
12.11 Coding Questions
For this problem, we will use the data Caschool. This data contains information about test scores for schools from California from the 1998-1999 academic year. For this problem, we will use the variables testscr (average test score in the school), str (student teacher ratio in the school), avginc (the average income in the school district), and elpct (the percent of English learners in the school).
Run a regression of test scores on student teacher ratio, average income, and English learners percentage. Report your results. Which regressors are statistically significant? How do you know?
What is the average test score across all schools in the data?
What is the predicted average test score for a school with a student teacher ratio of 20, average income of $30,000, and 10% English learners? How does this compare to the overall average test score from part (b)?
What is the predicted average test score for a school with a student teacher ratio of 15, average income of $30,000, and 10% English learners? How does this compare to your answer from part (c)?
For this problem, we will use the data intergenerational_mobility.
Run a regression of child family income (\(child\_fincome\)) on parents’ family income (\(parent\_fincome\)). How should you interpret the estimated coefficient on parents’ family income? What is the p-value for the coefficient on parents’ family income?
Run a regression of \(\log(child\_fincome)\) on \(parent\_fincome\). How should you interpret the estimated cofficient on \(parent\_fincome\)?
Run a regression of \(child\_fincome\) on \(\log(parent\_fincome)\). How should you interpret the estimated coefficient on \(\log(parent\_fincome)\)?
Run a regression of \(\log(child\_fincome)\) on \(\log(parent\_fincome)\). How should you interpret the estimated coefficient on \(\log(parent\_fincome)\)?
For this question, we’ll use the fertilizer_2000 data.
Run a regression of \(\log(avyield)\) on \(\log(avfert)\). How do you interpret the estimated coefficient on \(\log(avfert)\)?
Now suppose that you additionally want to control for precipitation and the region that a country is located in. How would you do this? Estimate the model that you propose here, report the results, and interpret the coefficient on \(\log(avfert)\).
Now suppose that you are interested in whether the marginal contrast for fertilizer varies by the region that a country is located in (while still controlling for the same covariates as in part (b)). Propose a model that can be used for this purpose. Estimate the model that you proposed, report the results, and discuss whether the marginal contrast for fertilizer appears to vary by region or not.
For this question, we will use the data mutual_funds. We’ll be interested in whether mutual funds that have higher expense ratios (these are typically actively managed funds) have higher returns relative to mutual funds that have lower expense ratios (e.g., index funds). For this problem, we will use the variables fund_return_3years, investment_type, risk_rating, size_type, fund_net_annual_expense_ratio, asset_cash, asset_stocks, asset_bonds.
Calculate the median fund_net_annual_expense_ratio.
Use the datasummary_balance function from the modelsummary package to report summary statistics for fund_return_3year, fund_net_annual_expense_ratio, risk_rating, asset_cash, asset_stocks, asset_bonds based on whether their expense ratio is above or below the median. Do you notice any interesting patterns?
Run a regression of fund_return_3years on fund_net_annual_expense_ratio. How do you interpret the results?
Now, additionally control for investment_type, risk_rating, and size_typeHint: think carefully about what type of variables each of these are and how they should enter the model. How do these results compare to the ones from part c?
Now, add the variables assets_cash, assets_stocks, and assets_bonds to the model from part d. How do you interpret these results? Compare and interpret the differences between parts c, d, and e.
For this question, we’ll use the data Lead_Mortality to study the relationship between lead pipes and infant mortality in 1900.
Run a regression of infant mortality (infrate) on whether or not a city had lead pipes (lead) and interpret/discuss the results.
It turns out that the amount of lead in drinking water depends on how acidic the water is, with more acidic water leaching more of the lead (so that there is more exposure to lead with more acidic water). To measure acidity, we’ll use the pH of the water in a particular city (ph); recall that, a lower value of pH indicates higher acidity. Run a regression of infant mortality on whether or not a city has lead pipes, the pH of its water, and the interaction between having lead pipes and pH. Report your results. What is the estimated marginal contrast for having lead pipes from this model?
Given the results in part b, calculate an estimate of the average marginal contrast for having lead pipes.
Given the results in part b, how much does the marginal contrast for having lead pipes differ for cities that have a pH of 6.5 relative to a pH of 7.5?
For this question, we’ll use the data Caschool to “manually” run a regression of test scores (testscr) on the student teacher ratio (str). You should not use the lm function for this problem; instead, use the formulas from this chapter to do each calculation yourself.
Calculate \(\hat{\beta}_0\) and \(\hat{\beta}_1\).
Calculate the standard error of \(\hat{\beta}_1\).
Calculate the p-value for testing \(H_0: \beta_1 = 0\).
Calculate a 95% confidence interval for \(\beta_1\).
12.12 Extra Questions
Suppose you run the following regression \[\begin{align*}
Earnings = \beta_0 + \beta_1 Education + U
\end{align*}\] with \(\E[U|Education] = 0\). How do you interpret \(\beta_1\) here?
Suppose you run the following regression \[\begin{align*}
Earnings = \beta_0 + \beta_1 Education + \beta_2 Experience + \beta_3 Female + U
\end{align*}\] with \(\E[U|Education, Experience, Female] = 0\). How do you interpret \(\beta_1\) here?
Suppose you are interested in testing whether the marginal contrast for education in a regression where the outcome is earnings is the same for men and women.
Propose a regression and strategy for this sort of test.
Suppose you also want to control for experience in conducting this test, how would do it?
Suppose you run the following regression \[\begin{align*}
\log(Earnings) = \beta_0 + \beta_1 Education + \beta_2 Experience + \beta_3 Female + U
\end{align*}\] with \(\E[U|Education, Experience, Female] = 0\). How do you interpret \(\beta_1\) here?
A common extra condition (though somewhat old-fashioned) is to impose homoskedasticity. Homoskedasticity says that \(\E[U^2|X] = \sigma^2\) (i.e., the variance of the error term does not change across different values of \(X\)).
Under homoskedasticity, the expression for \(V\) in Equation 12.5 simplifies. Provide a new expression for \(V\) under homoskedasticity. Hint: you will need to use the law of iterated expectations.
Using this expression for \(V\), explain how to calculate standard errors for an estimate of \(\beta_1\) in a simple linear regression.
Explain how to construct a t-statistic for testing \(H_0: \beta_1=0\) under homoskedasticity.
Explain how to contruct a p-value for \(\beta_1\) under homoskedasticity.
Explain how to construct a 95% confidence interval for \(\beta_1\) under homoskedasticity.