a function to plot results with a continuous treatment
Examples
# \donttest{
# build small simulated data
set.seed(1234)
df <- simulate_contdid_data(
n = 5000,
num_time_periods = 4,
num_groups = 4,
dose_linear_effect = 0,
dose_quadratic_effect = 0
)
# estimate effects of continuous treatment
cd_res <- cont_did(
yname = "Y",
tname = "time_period",
idname = "id",
dname = "D",
data = df,
gname = "G",
target_parameter = "slope",
aggregation = "dose",
treatment_type = "continuous",
control_group = "notyettreated",
biters = 50,
cband = TRUE,
num_knots = 1,
degree = 3,
)
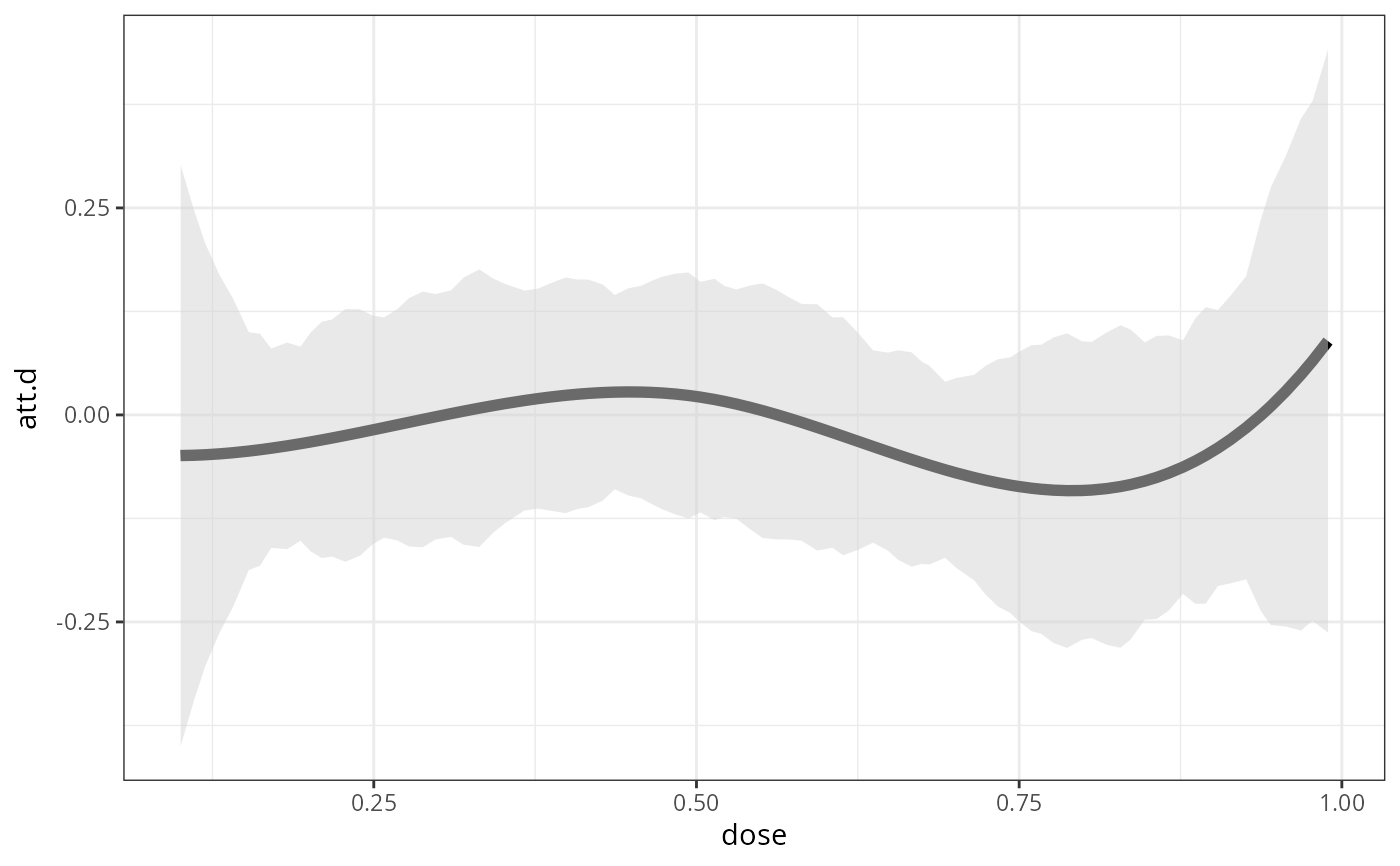
# plot ATT as a function of the dose
ggcont_did(cd_res, type = "att")
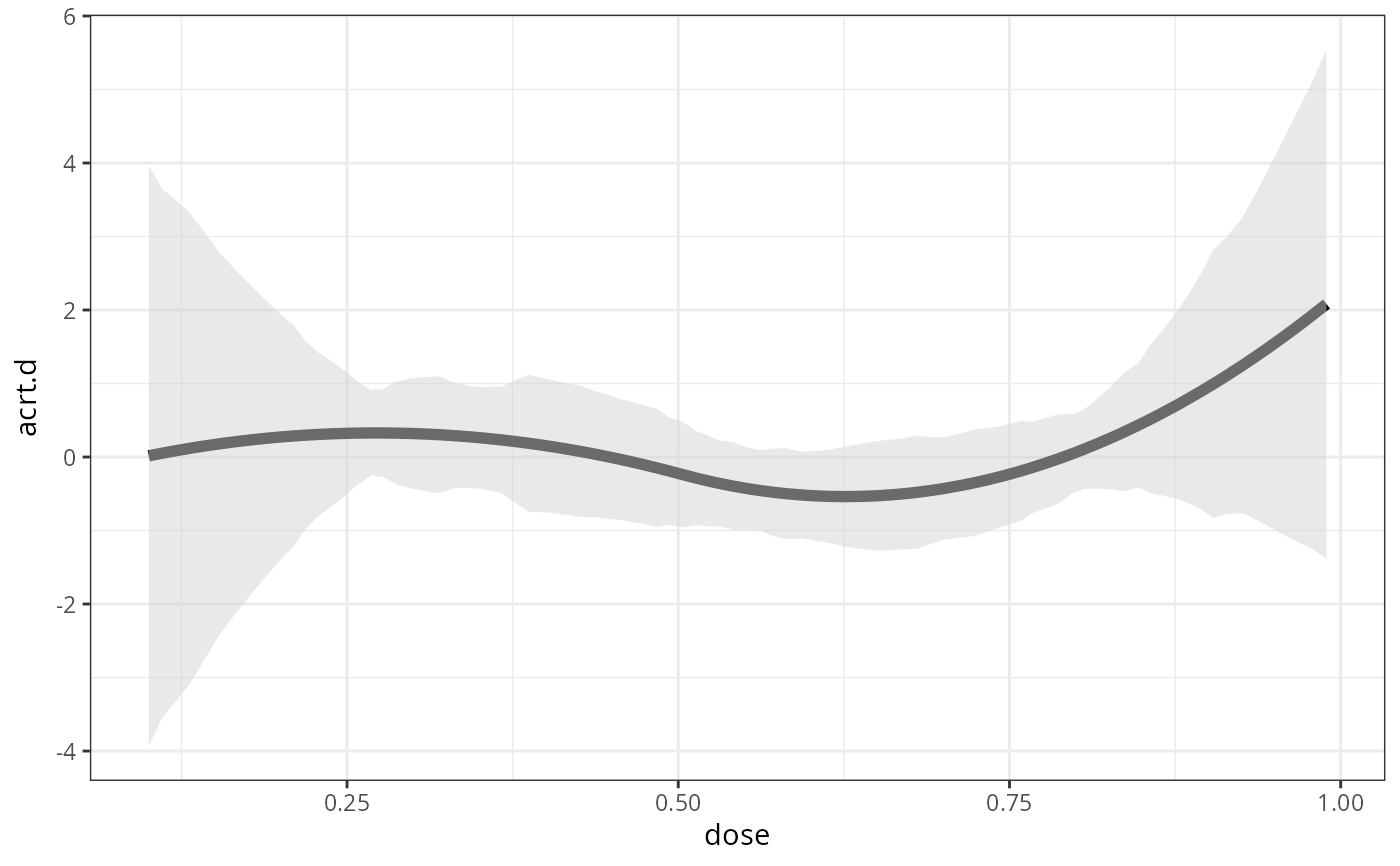
 # plot ACRT as a function of the dose
ggcont_did(cd_res, type = "acrt")
# plot ACRT as a function of the dose
ggcont_did(cd_res, type = "acrt")
 # }
# }